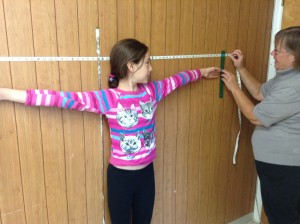
Math class for our 6th graders this fall has been about statistics. We started with gathering, graphing and interpreting data from our classmates about name length. We graphed our data on line plots and bar graphs. We even used a stem leaf plot. We’ve explored mode, median, range and coordinate points. We’ve learned about numerical vs categorical data. Most recently we had an exciting class where we discussed the idea that your arm span is about the same measurement as your height. We looked at data from a middle school class provided in our math book and then did some data gathering to find out ourselves if this was true. And it was SO close to being true. Most people had heights that were very close to their arm span and two of us had exactly the same! We then graphed our data on a coordinate system and drew a line of best fit. As we wrap up our statistics unit, we’ll be exploring mean and practicing what we’ve been learning using the IXL computer program, worksheets and our math text books.
